Black & White / Accessibility Mode
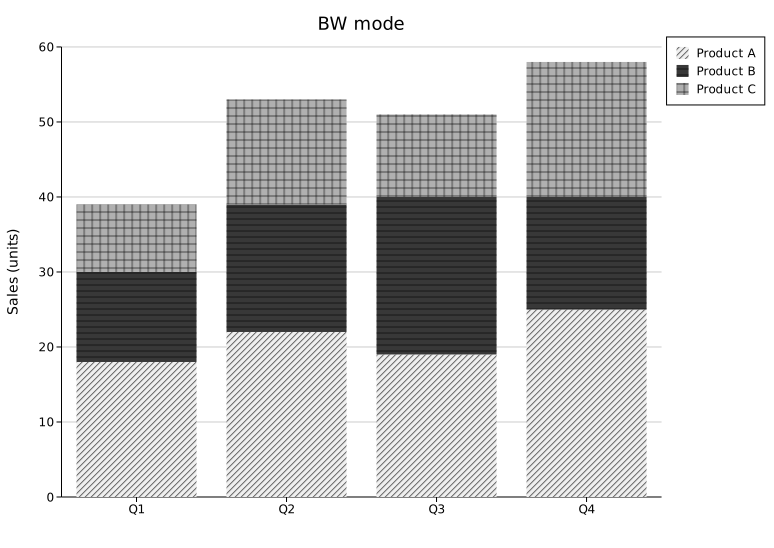
BW mode redraws every plot so it stays legible without relying on color: discrete series are told apart by hatch pattern and grey shade instead of hue, lines cycle through dash styles, scatter markers cycle through shapes, and continuous colormaps are forced to a grayscale ramp. It exists for two overlapping needs — figures that will be printed or photocopied in greyscale, and readers with color-vision deficiencies who can't rely on hue-only encoding.
For a colored (not greyscale) approach to color-vision deficiency, see --cvd-palette in Shared flags instead — it remaps hues so a deuteranope/protanope/tritanope reader can still distinguish series by color. BW mode is the stronger guarantee: it works even when color reproduction fails entirely.
Enabling it
Rust API
.with_bw_mode() is the only change needed — everything else about the plot stays the same:
#![allow(unused)]
fn main() {
use kuva::backend::svg::SvgBackend;
use kuva::plot::BarPlot;
use kuva::render::layout::Layout;
use kuva::render::plots::Plot;
use kuva::render::render::render_multiple;

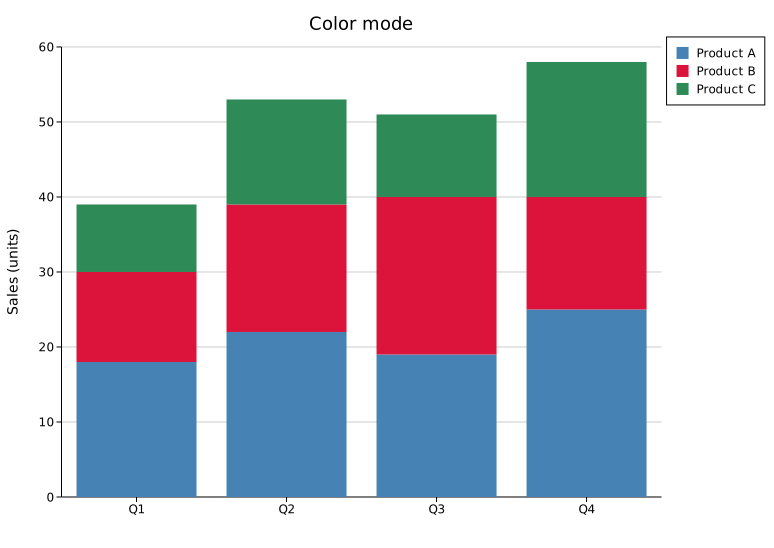
let plot = BarPlot::new()
    .with_group("Q1", vec![(18.0, "steelblue"), (12.0, "crimson"), (9.0, "seagreen")])
    .with_group("Q2", vec![(22.0, "steelblue"), (17.0, "crimson"), (14.0, "seagreen")])
    .with_legend(vec!["Product A", "Product B", "Product C"])
    .with_stacked();

let plots = vec![Plot::Bar(plot)];
let layout = Layout::auto_from_plots(&plots)
    .with_bw_mode()
    .with_title("BW mode");

let scene = render_multiple(plots, layout);
let svg = SvgBackend.render_scene(&scene);
std::fs::write("bw_mode.svg", svg).unwrap();
}
 |
 |
CLI
kuva scatter data.tsv --x x --y y --color-by group --legend --bw
kuva bar data.tsv --label-col category --value-col count --bw
--bw works on every subcommand and composes with --theme/--background — BW mode changes data encoding (series differentiation, colormaps), not chrome colors.
What changes
Discrete series (bar, box, violin, pie, area, and similar fills)
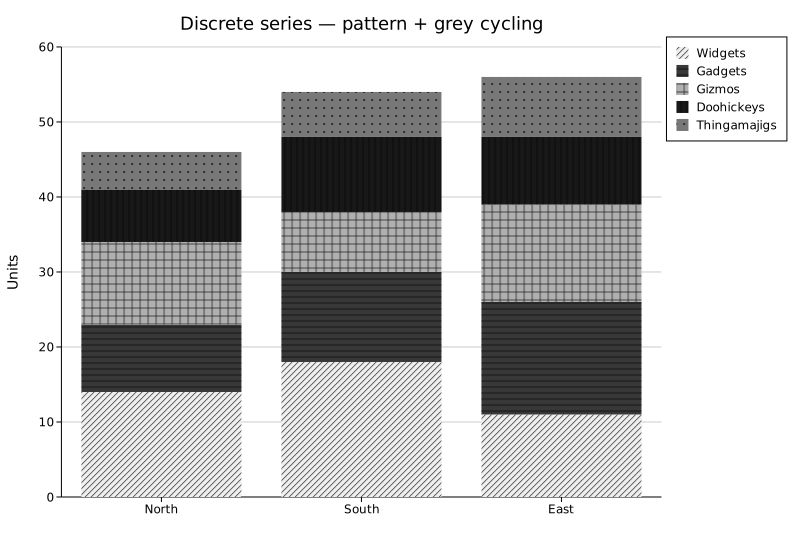
Each series/group gets one of 5 grey shades combined with one of 7 hatch patterns — 35 unique combinations before any repeat, so even plots with many groups stay distinguishable:
| Pattern | Description |
|---|---|
DiagonalForward | Forward-diagonal lines (///) |
Horizontal | Horizontal parallel lines |
Crosshatch | Horizontal + vertical grid |
Vertical | Vertical parallel lines |
Dots | Evenly spaced dots |
DiagonalBack | Back-diagonal lines (\\\) |
DiagonalCrosshatch | Forward + back diagonal grid (×××) |
Hatch line weight is a light 0.6px stroke (tuned so patterns read as texture, not bold stripes — see the CHANGELOG for the full comparison).
Lines
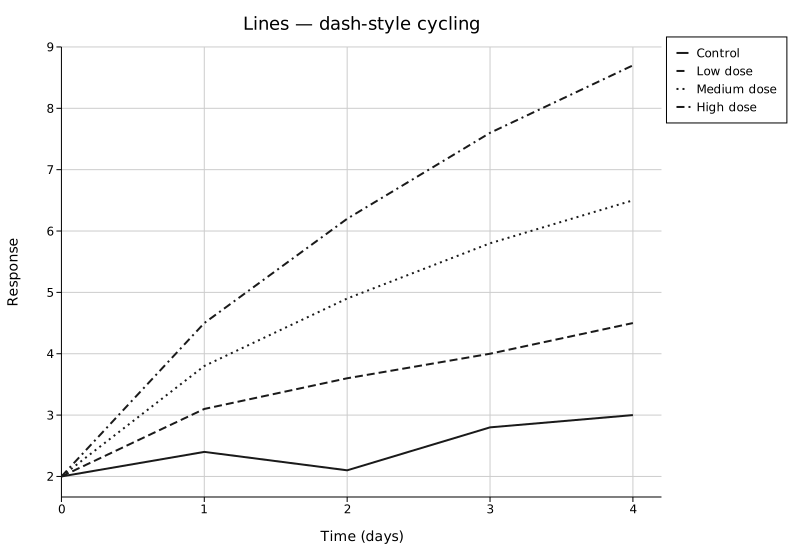
Each line series cycles through 4 dash styles: Solid, Dashed, Dotted, DashDot.
#![allow(unused)]
fn main() {
use kuva::backend::svg::SvgBackend;
use kuva::plot::LinePlot;
use kuva::render::layout::Layout;
use kuva::render::plots::Plot;
use kuva::render::render::render_multiple;

let series: Vec<Plot> = vec![
    ("Control", vec![(0.0, 2.0), (1.0, 2.4), (2.0, 2.1), (3.0, 2.8), (4.0, 3.0)]),
    ("Low dose", vec![(0.0, 2.0), (1.0, 3.1), (2.0, 3.6), (3.0, 4.0), (4.0, 4.5)]),
    ("High dose", vec![(0.0, 2.0), (1.0, 4.5), (2.0, 6.2), (3.0, 7.6), (4.0, 8.7)]),
]
.into_iter()
.map(|(name, data)| Plot::Line(LinePlot::new().with_data(data).with_legend(name)))
.collect();

let layout = Layout::auto_from_plots(&series).with_bw_mode();
let svg = SvgBackend.render_scene(&render_multiple(series, layout));
std::fs::write("bw_lines.svg", svg).unwrap();
}
Scatter / point markers
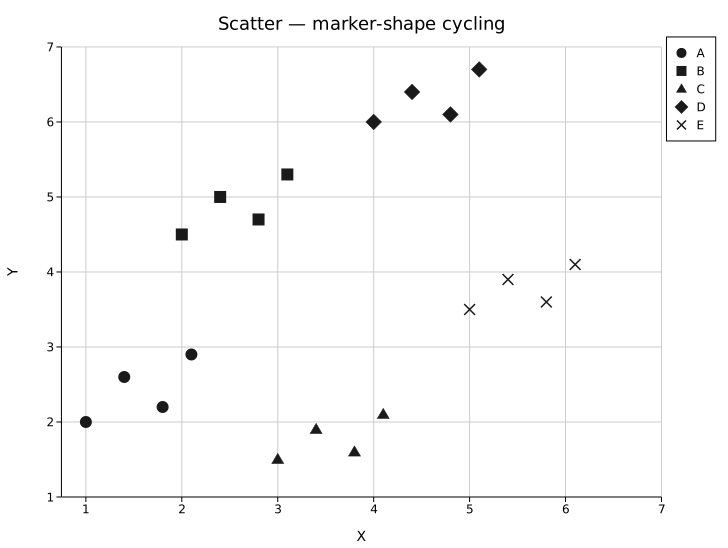
Each series cycles through 6 marker shapes: Circle, Square, Triangle, Diamond, Cross, Plus.
Continuous colormaps (heatmap, hexbin, contour, calendar, and similar)
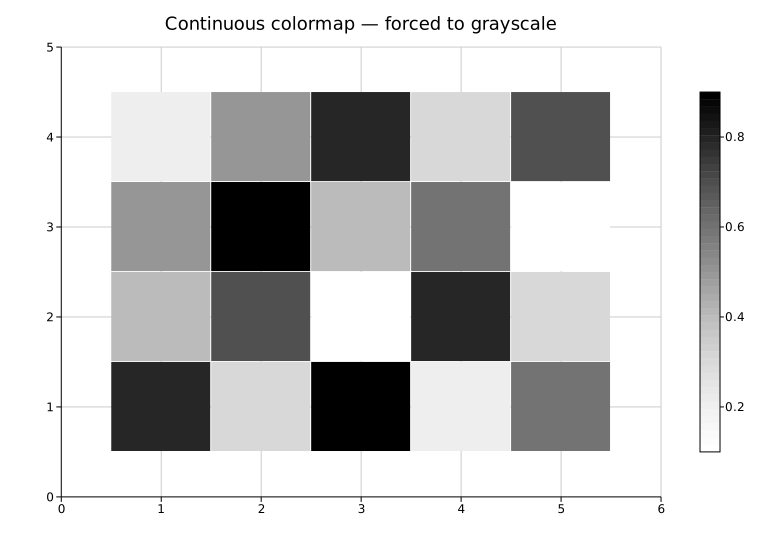
Plots that encode a continuous numeric value via a colormap (rather than discrete series) swap their configured ColorMap for ColorMap::Grayscale — a white-to-black ramp — at render time. This is unconditional and doesn't require picking a colormap yourself; the swap happens automatically whenever bw_mode is on.
Scatter3D's colorbar is suppressed entirely in BW mode rather than grayscaled, since its point fills already ignore z_colormap in favor of a flat marker color.
Coverage
All plot types in kuva support BW mode — pixel-space/composite plots (Chord, Sankey, PhyloTree, Synteny, Network, Treemap, Sunburst, Clustermap) included, each with its own bespoke fill/stroke treatment since they don't share a common bar/line/marker helper.
Known limitations
A few characteristics are accepted trade-offs rather than bugs, tracked for a future pass:
- Sankey / Synteny node borders. Ribbons intentionally share their source node's/sequence's pattern, so a node's rectangle boundary can be hard to see where a ribbon touches it with an identical pattern. Both get a thin outline in BW mode to mitigate this, but it isn't a complete fix — only about half the nominal stroke width survives, since the pattern-overlay rect drawn on top eclipses the inner half of the stroke.
- Hexbin / DotPlot / Quiver at the low end of the grayscale range.
ColorMap::Grayscaleruns white-to-black, so a data point near the low end renders very close to white — genuinely hard to see against a white page for plots whose fill primitive has no default outline (unlike Heatmap/Clustermap/Contour, where adjacent cells already have a border). Horizontalpattern at small cell sizes (e.g. Waffle's default cell size) can look nearly solid rather than textured — the tile period (6-8px) is comparable to the cell size itself, so thinning the stroke further doesn't help.
Custom pattern control
There is currently no user-facing way to choose which patterns/dashes/shapes are used or in what order, or to define custom patterns — BW mode always cycles through the fixed sequences above. A more flexible styling system (custom pattern palettes, additional built-in palette presets) is a candidate for a future release.