Colormaps
A ColorMap maps a normalized value in [0.0, 1.0] to a CSS color string. Use it wherever a plot encodes a continuous quantity as color: heatmap cell values, hexbin/2D-histogram density, treemap/sunburst second-dimension coloring, 3D surface height, and more. This is a different tool from a Palette: a palette assigns distinct colors to separate categorical series, while a colormap encodes one continuous variable along a gradient.
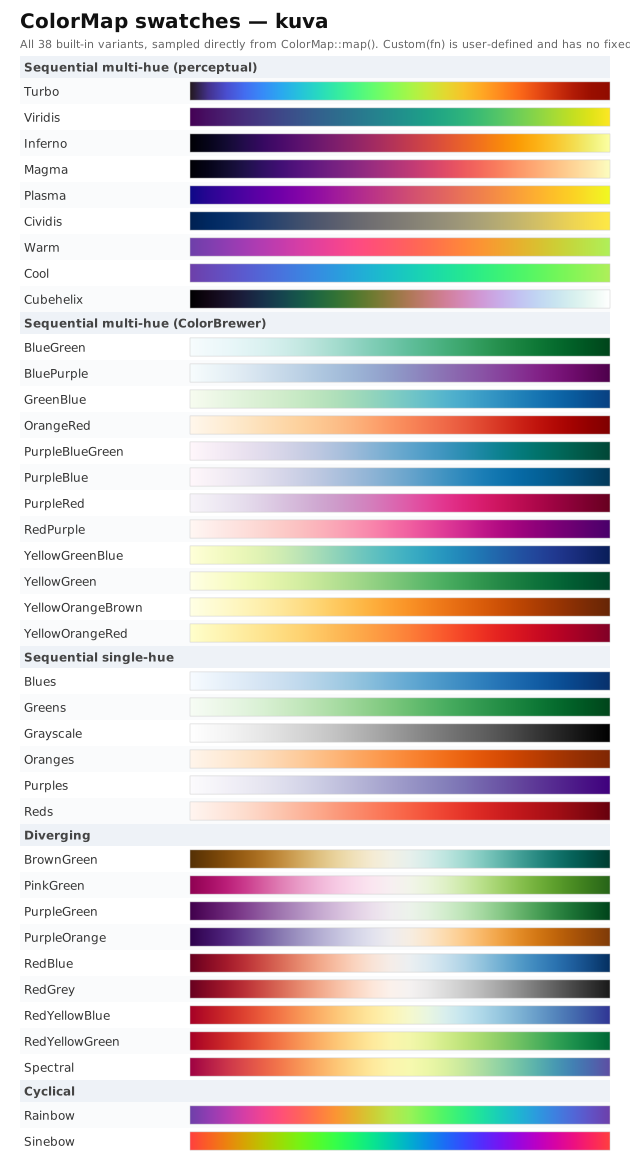
All 38 built-in variants
Every gradient below is rendered directly from the real ColorMap::map() function, not a hand-approximated copy.
Using a colormap
On a plot
Most plot types that encode continuous values take a colormap via .with_color_map() (or a type-specific equivalent):
#![allow(unused)]
fn main() {
use kuva::plot::{ColorMap, Heatmap};

let heatmap = Heatmap::new()
    .with_data(vec![vec![1.0, 2.0], vec![3.0, 4.0]])
    .with_color_map(ColorMap::Viridis);
}
Sampling directly
ColorMap::map(value) returns the CSS color at that point on the gradient, useful for building custom legends, annotations, or your own derived visuals:
#![allow(unused)]
fn main() {
use kuva::plot::ColorMap;

let cmap = ColorMap::Turbo;
let low = cmap.map(0.0);   // color at the start of the gradient
let mid = cmap.map(0.5);   // color at the midpoint
let high = cmap.map(1.0);  // color at the end
}
CLI
Most subcommands that support a colormap accept --colormap <name>:
kuva heatmap data.tsv --colormap viridis
kuva hexbin data.tsv --x x --y y --colormap turbo
kuva treemap data.tsv --color-by value --colormap plasma
Accepted names are case-insensitive and accept either a bare word or a hyphenated ColorBrewer-style alias (e.g. yellow-green-blue, yellowgreenblue, and ylgnbu all resolve to the same colormap). An unrecognized name falls back to viridis with a warning rather than failing.
Custom colormaps
Wrap any f64 -> String mapping in ColorMap::Custom for a colormap kuva doesn't ship:
#![allow(unused)]
fn main() {
use std::sync::Arc;
use kuva::plot::ColorMap;

// Blue-to-red diverging scale
let cmap = ColorMap::Custom(Arc::new(|t: f64| {
    let r = (t * 255.0) as u8;
    let b = ((1.0 - t) * 255.0) as u8;
    format!("rgb({r},0,{b})")
}));
}
Custom has no fixed swatch since its output depends entirely on the closure you provide.
API reference
| Variant category | Variants |
|---|---|
| Sequential multi-hue (perceptual) | Turbo, Viridis, Inferno, Magma, Plasma, Cividis, Warm, Cool, Cubehelix |
| Sequential multi-hue (ColorBrewer) | BlueGreen, BluePurple, GreenBlue, OrangeRed, PurpleBlueGreen, PurpleBlue, PurpleRed, RedPurple, YellowGreenBlue, YellowGreen, YellowOrangeBrown, YellowOrangeRed |
| Sequential single-hue | Blues, Greens, Grayscale, Oranges, Purples, Reds |
| Diverging | BrownGreen, PinkGreen, PurpleGreen, PurpleOrange, RedBlue, RedGrey, RedYellowBlue, RedYellowGreen, Spectral |
| Cyclical | Rainbow, Sinebow |
| Custom | Custom(Arc<dyn Fn(f64) -> String + Send + Sync>) (user-defined) |
| Method | Description |
|---|---|
cmap.map(value) | CSS color string at value (clamped to [0.0, 1.0]) |
Picking a colormap:
Viridisis the default for most plots; perceptually uniform and colorblind-safe, a safe general choice.- Reach for
Grayscalewhen a plot needs to survive black & white printing (see Black & White / Accessibility Mode). - Use a diverging colormap (
RedBlue,PurpleGreen,Spectral, ...) when the data has a meaningful zero or midpoint, e.g. log-fold-change or a correlation coefficient, so the two directions read as visually distinct. - Use
RainboworSinebowonly for genuinely cyclical data (e.g. angle, day-of-year, phase), never for a plain sequential quantity: cyclical colormaps wrap back to their starting hue, which reads as a false discontinuity on any variable that doesn't actually wrap.