Quiver Plot
A quiver plot visualises a 2-D vector field as a grid of arrows. Each arrow has a tail at data coordinates (x, y) and a vector (u, v) that controls its direction and length. Quiver plots are the canonical way to show fluid flow, force fields, gradients, wind / current patterns, and any other data where each location has an associated direction and magnitude.
Import path: kuva::plot::quiver::QuiverPlot
Basic usage
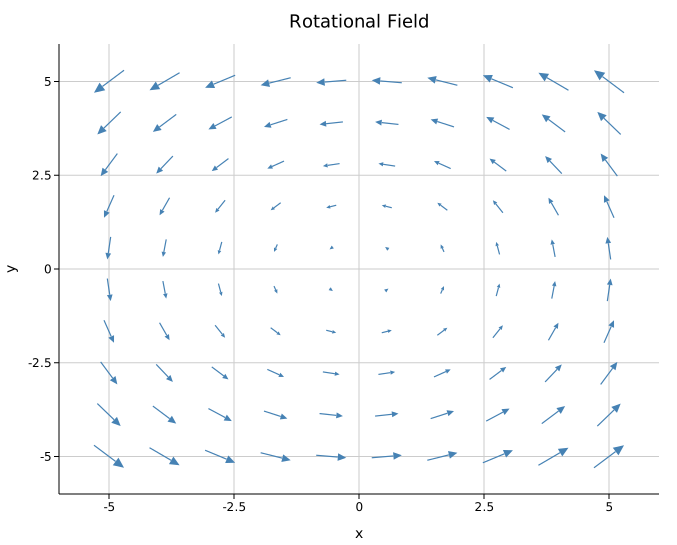
The most common case is sampling a vector-field closure f: (x, y) → (u, v) on a regular grid. Use QuiverPlot::from_function:
#![allow(unused)]
fn main() {
use kuva::plot::QuiverPlot;
use kuva::backend::svg::SvgBackend;
use kuva::render::render::render_multiple;
use kuva::render::layout::Layout;
use kuva::render::plots::Plot;

// Rotational field: (u, v) = (-y, x) on a 10×10 grid.
let plot = QuiverPlot::from_function(
    (-5.0, 5.0, 10),
    (-5.0, 5.0, 10),
    |x, y| (-y * 0.3, x * 0.3),
)
    .with_color("steelblue");

let plots = vec![Plot::Quiver(plot)];
let layout = Layout::auto_from_plots(&plots)
    .with_title("Rotational Field")
    .with_x_label("x")
    .with_y_label("y");

let svg = SvgBackend.render_scene(&render_multiple(plots, layout));
std::fs::write("quiver.svg", svg).unwrap();
}
For irregular data (not on a grid), add arrows one at a time with .with_arrow(x, y, u, v), or pass an iterator of (x, y, u, v) tuples to .with_arrows().
Scaling
By default the scale multiplier is auto-computed so the longest arrow is roughly one grid cell long — approximated as span / √n for n arrows on a span of R. This prevents arrows from overlapping each other in dense fields, so zero-config quiver plots look sensible no matter what units (u, v) are in.
Two overrides are available when you need explicit control:
.with_scale(s)— pin the multiplier. Arrow length in data coords is(u, v) * s..with_auto_scale(fraction)— keep auto-scaling on, but change the target fraction of the nearest-neighbor distance (default0.9). Values near1.0pack arrows tip-to-tail; smaller values leave more breathing room.
Pivot
By default, (x, y) is the arrow's tail — the arrow points away from that point. For data where (x, y) is the location at which a field is being sampled, QuiverPivot::Middle centers each arrow on its data point, which reads more naturally as "what the field is doing at this location":
#![allow(unused)]
fn main() {
use kuva::plot::{QuiverPlot, QuiverPivot};
use kuva::render::plots::Plot;

let plot = QuiverPlot::new()
    .with_arrow(0.0, 0.0, 1.0, 0.0)
    .with_pivot(QuiverPivot::Middle);
}
QuiverPivot::Tip makes (x, y) the arrow's tip (the arrow comes into the point).
Coloring by magnitude
Passing a ColorMap colors each arrow by its magnitude sqrt(u² + v²) and automatically renders a colorbar.
#![allow(unused)]
fn main() {
use kuva::plot::quiver::QuiverPlot;
use kuva::plot::ColorMap;
use kuva::render::plots::Plot;

let plot = QuiverPlot::new()
    .with_arrow(0.0, 0.0, 1.0, 0.0)
    .with_arrow(1.0, 0.0, 0.5, 0.5)
    .with_color_map(ColorMap::Viridis)
    .with_color_legend_label("Speed");
}
Priority: per-arrow color (via .with_colored_arrow()) > colormap > single color.
Arrow styling
.with_shaft_width(px)— stroke width of the shaft (default1.2)..with_head_ratio(r)— head length as a fraction of the shaft (default0.28). Heads are always proportional by default, so every arrow looks like an arrow regardless of magnitude..with_head(length_px, half_width_px)— pin the head to fixed pixel dimensions. Useful when you want identical glyphs across a mixed-magnitude field.
Proportional heads are clamped to [4, 14] pixels so tiny arrows still show a visible head and long arrows don't grow gigantic ones. The shaft is automatically shortened so it terminates at the base of the head, not overlapping it.
CLI
Input: one row per arrow with four numeric columns: tail x, tail y, u-component, v-component.
| Flag | Default | Description |
|---|---|---|
--x-col <COL> | 0 | Tail X column |
--y-col <COL> | 1 | Tail Y column |
--u-col <COL> | 2 | Vector x-component column |
--v-col <COL> | 3 | Vector y-component column |
--color <CSS> | steelblue | Arrow color (overridden by --colormap) |
--arrow-scale <F> | — | Pin (u, v) multiplier (disables auto-scaling) |
--auto-scale <F> | 0.9 | Fraction of the nearest-neighbor distance for the longest arrow |
--shaft-width <PX> | 1.2 | Shaft stroke width |
--head-length <PX> | proportional | Pin head length to fixed pixels (default is 28% of shaft, clamped to 4–14 px) |
--head-width <PX> | proportional | Pin head half-width to fixed pixels |
--colormap <NAME> | — | Color arrows by magnitude (see CLI reference for names) |
--colorbar-label <TXT> | — | Colorbar title |
--pivot <MODE> | tail | Where (x, y) sits on each arrow: tail, middle, or tip |
--tight-bounds | off | Derive axis bounds from arrow tails only |
--legend <TXT> | — | Legend entry label |
# Zero config — auto-scaling picks a sensible arrow length.
kuva quiver field.tsv \
    --title "Velocity Field" --x-label "x" --y-label "y"

# Color by magnitude with a viridis colorbar
kuva quiver field.tsv --colormap viridis --colorbar-label "Speed"

# Tighter field (longer arrows fill the plot) + tails-only axis bounds.
kuva quiver field.tsv --auto-scale 0.95 --tight-bounds

# Pick columns by name
kuva quiver field.tsv \
    --x-col lon --y-col lat --u-col wind_u --v-col wind_v
See also: Contour Plot for a scalar-field alternative to a vector field, Polar Plot for angle/magnitude data in Cartesian form.
See also: Shared flags — output, appearance, axes.